
 Available in US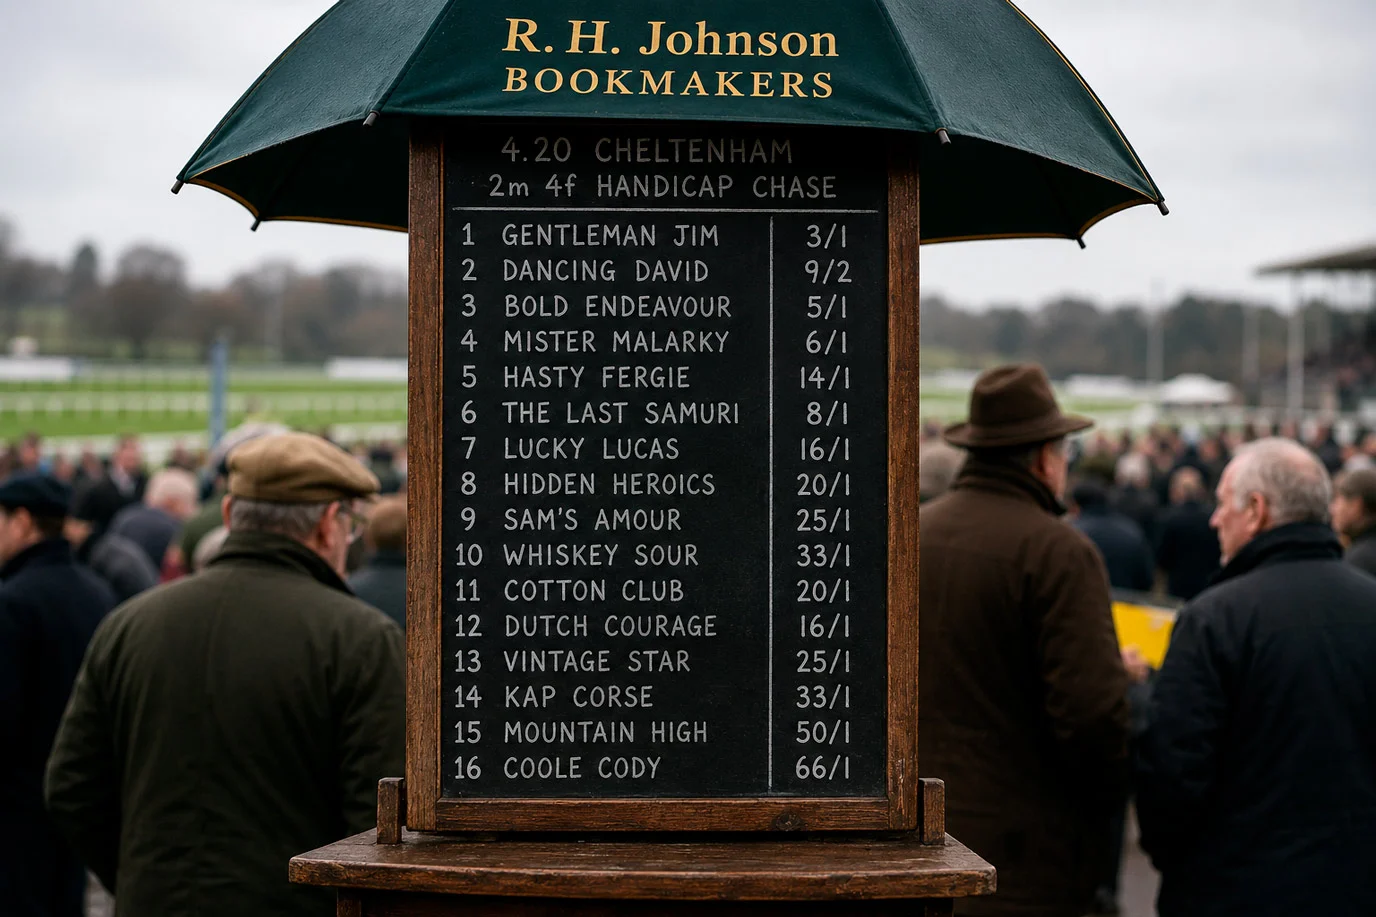
Overround Calculation: Field Size and Layer Margins
Every UK racing market carries an embedded fee that punters pay without ever seeing it. It’s called overround – sometimes “vig” or “margin” in the American sense – and it’s the percentage by which the implied probabilities of all runners in a market exceed 100 per cent. A fair-priced 5-runner race where each horse has an equal 20 per cent chance of winning would price every horse at exactly 4/1. A bookmaker’s 5-runner race with the same chances priced at 7/2 each gives every horse an implied probability of 22.2 per cent – implied probabilities summing to 111 per cent, an overround of 11 per cent. That 11 per cent is the layer’s margin, baked into every bet.
Reading overround is the most undervalued skill in UK punting. The market with a 105 per cent overround is genuinely a different proposition from one with 125 per cent overround – the punter is paying a 5 per cent fee in the first market and a 25 per cent fee in the second. Across a season of betting, the cumulative cost of consistently betting in higher-overround markets is enormous.
The good news is that UK racing overrounds are visible if you take a minute to compute them. The bad news is that almost no recreational punters do. Most bet on the price they see without ever asking whether that price is offered inside a tight book or a wide one. The professional punter’s first job on any race is computing the overround. If you’re not doing that, you’re consistently paying more margin than you need to.
How Overround Calculates
The arithmetic is straightforward. For each runner, convert the fractional odds to implied probability using the formula: probability equals denominator divided by (numerator plus denominator). A horse priced 5/1 has implied probability of 1/(5+1) = 16.7 per cent. A horse priced 4/1 has implied probability of 1/(4+1) = 20 per cent.
Add the implied probabilities for every runner. A fair market would sum to 100 per cent (allowing for the small inefficiency around dead-heats and other settlement edge cases). A bookmaker’s market routinely sums to 110 to 130 per cent. The amount over 100 per cent is the overround – the layer’s margin.
For an 8-runner field with prices 6/4, 7/2, 5/1, 8/1, 12/1, 16/1, 25/1, 33/1, the implied probabilities sum to: 40 + 22.2 + 16.7 + 11.1 + 7.7 + 5.9 + 3.8 + 2.9 = 110.3 per cent. The overround is 10.3 per cent. That’s a competitively-priced UK handicap.
The same 8 runners priced at 6/4, 11/4, 4/1, 6/1, 10/1, 14/1, 20/1, 28/1 would sum to roughly 119 per cent – a 19 per cent overround. Same field, looser book, you’re paying 9 percentage points more margin to bet in this market than in the previous example. Across a season, that’s the difference between a marginally losing punter and a substantially losing punter.
How Field Size Affects the Book
Larger fields tend to carry higher overrounds, almost without exception. The structural reason is layer risk – the more runners, the more outcomes the bookmaker has to book, and the more margin they need to charge to protect against all of them simultaneously. A 4-runner conditions race might run at 102 to 105 per cent overround. A 30-runner Grand National field can run at 130 to 140 per cent overround.
The 2025 BHA field-size data shows Flat racing averaged 8.90 runners per race, jumps 7.84. Inside those averages, the distribution skews toward smaller fields – most days, most races have under 10 runners. Premier Fixtures average 11.02 Flat and 9.41 jumps, with bigger handicaps regularly hitting 16-plus and Festival handicaps routinely 20-plus. The overround calculation across these different race types varies substantially.
One quirk: place markets carry higher overrounds than win markets on the same race. The reason is layer exposure on the place book – multiple winning outcomes increase risk variance, and layers compensate with thicker margins. A win market at 110 per cent overround on a 16-runner handicap might have a place market at 115 to 118 per cent – measurably wider, even on the same race.
Each-way fractions are the real margin lever for layers. The choice of 1/4 versus 1/5 place fraction shifts the implied place price substantially, and the layer’s competitive positioning on this choice can be more impactful than the headline win-market overround. Each-way betting at Cheltenham 2024 was up 25 per cent year on year – punters increasingly playing the bet type where the place fraction is the dominant pricing variable.
Why Some Markets Are Tighter Than Others
UK racing markets vary widely in overround. The competitive Saturday markets – Premier Fixtures, Group race meetings, Festival cards – typically run at 105 to 115 per cent overround on win markets. The midweek small-field markets at lesser tracks can run at 120 to 135 per cent overround, particularly on early morning prices before money flows in to compress the book.
The £9.12 billion online betting turnover on horse racing in 2022-23 reflects a market under pressure – that’s down £900 million on the previous year, and in real terms after inflation, down approximately £1.75 billion. Operators responding to volume compression have generally tightened books on the most-traded races and loosened them on the under-traded ones. Saturday Premier Fixtures get tight competitive pricing because the operators are competing for high-volume action; Wednesday evening minor meetings get looser pricing because the operators have less to lose by quoting wide.
Exchange markets – Betfair Exchange in particular – typically run tighter than fixed-odds bookmaker markets. The exchange’s commission model takes a percentage of net wins rather than building margin into the prices, which means the matched prices effectively reflect punter-to-punter equilibrium without layer margin. Overrounds on Betfair markets on competitive UK races often sit at 101 to 104 per cent. The trade is that exchange prices are subject to liquidity – getting matched at the displayed price isn’t always possible on smaller markets.
The HBLB Annual Report noted turnover per race down 8 per cent year on year through 2024-25, 15 per cent against 2022-23, and 19 per cent against 2021-22. The cumulative compression has driven operators to defend margins more carefully on the races where competitive pricing has historically driven volume – the Saturday afternoon programme, the Festival weeks, the major handicaps. Outside those, overrounds are routinely wider than punters realise.
Reading Overround Before You Bet
The practical workflow for an overround-conscious punter takes about 30 seconds per race. Open the racecard, look at the displayed prices, mentally tot up the implied probabilities, see whether the market sums to a tight book (sub-110 per cent) or a wide one (115-plus). On wide books, bet sparingly; on tight books, look for value.
The shortcut for those who don’t want to calculate: compare the top-three favourites’ combined implied probabilities. A 5/2, 7/2, 9/2 trio implies 28.6 + 22.2 + 18.2 = 69 per cent of the win probability concentrated in three horses. If the remaining 5+ runners’ implied probabilities sum to over 50 per cent, the book is wider than it should be. The shorter the prices are on the longshots – especially the 16/1 and 25/1 fillers – the wider the overall book.
Different operators run different overrounds on the same race. A horse priced 8/1 at one layer might be 9/1 at another – same horse, same race, different prices, different operator margins. The major Saturday meetings see the closest cross-operator pricing because the layers are competing hardest there. The midweek smaller fields see the widest cross-operator spread because the layers don’t compete on those markets as actively.
For the strategic question of how starting price compares to early price within these margin dynamics, the SP versus early-price piece covers the price-timing question that interacts with overround in important ways.
Overround Questions
Two questions come up regularly about overround – whether comparing margins across operators is genuinely worth the time, and whether overround applies in the same way to in-play markets.
Articles
Published by the typesbethors team.
